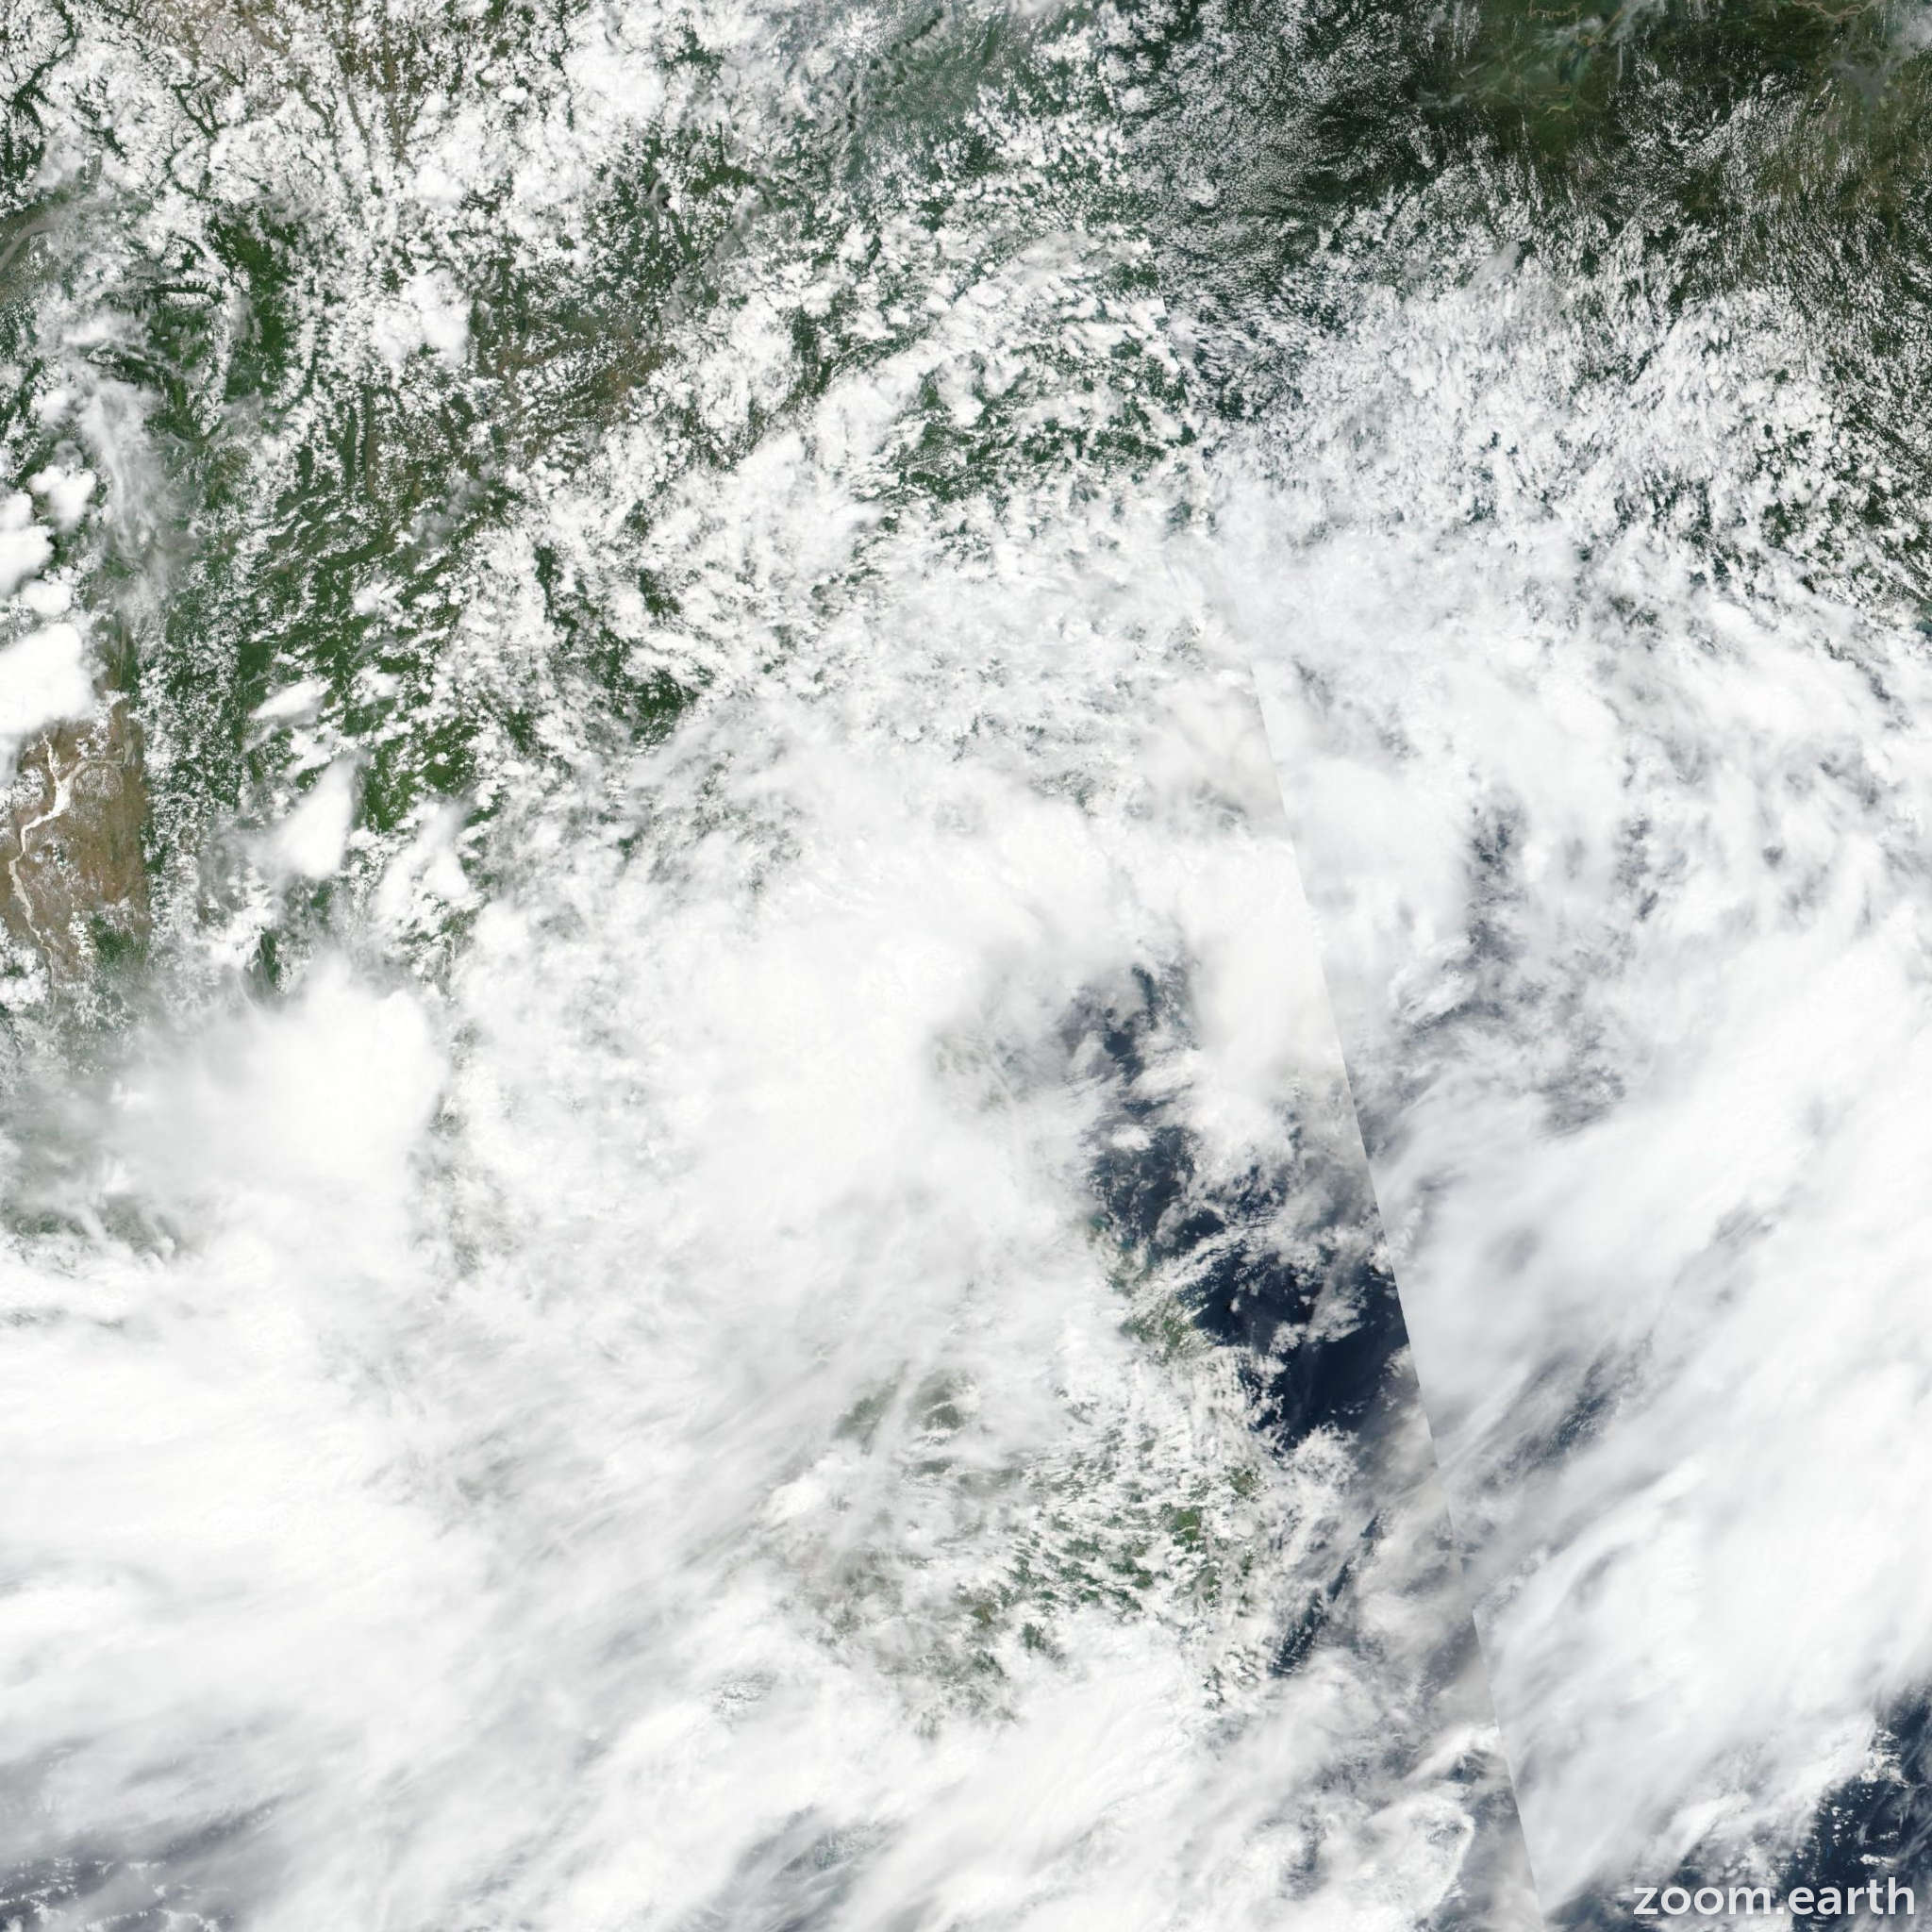
When Super Typhoon Sinlaku tore through the Western Pacific, it wasn't just another seasonal monster. It was a failure of expectations. While NASA’s orbiting sensors captured the swirling violence of its $230$ km/h winds, the real story wasn't the wreckage on the ground, but the gaps in our overhead surveillance. We have more eyes in space than at any point in human history, yet Sinlaku proved that raw data often obscures the terrifying reality of rapid intensification.
Understanding Sinlaku requires moving past the satellite imagery of a perfect white spiral. The storm underwent a transformation that defied standard meteorological modeling, shifting from a disorganized cluster of thunderstorms into a Category 5 equivalent in a window of time that left coastal authorities scrambling. This wasn't a failure of effort; it was a limitation of the physics behind our current remote sensing tools.
[Image of the structure of a tropical cyclone]
The Myth of Total Surveillance
We live under the impression that the planet is under constant, high-definition scrutiny. The reality is far more fragmented. Satellites like the Tropical Rainfall Measuring Mission (TRMM) provide snapshots, not a continuous live feed. Between these snapshots, a storm can undergo radical internal shifts that go undetected until it is too late to update evacuation orders.
During Sinlaku's peak, the primary challenge wasn't seeing the storm, but peering through its wall of water. Traditional infrared sensors see the tops of the clouds. They measure temperature. While cold cloud tops usually indicate high-reaching, powerful thunderstorms, they don't tell the whole story about the wind speeds at the surface. To get that, we rely on microwave imagers that can "see" through the clouds to the rain below.
The problem? These microwave sensors are often mounted on polar-orbiting satellites. They pass over a specific spot on Earth only a few times a day. If Sinlaku decides to double its power in the six-hour gap between those passes, the world stays blind to the escalation. We are effectively watching a high-speed chase through a strobe light.
Why Rain Layers Define the Kill Zone
The "hot tower" hypothesis became a central focus during the analysis of Sinlaku. A hot tower is a massive rain cell that reaches all the way to the top of the troposphere. When these towers appear in the eyewall of a typhoon, they act like a turbocharger. They release massive amounts of latent heat, which lowers the surface pressure and causes the storm to suck in more air, spinning it faster and faster.
NASA's data showed these towers in Sinlaku, but the timing of the observation was the sticking point. By the time the data was processed and beamed back to Earth, the intensification was already underway.
The Latent Heat Engine
To understand the "why" behind the destruction, you have to look at the energy exchange. A typhoon is a heat engine. It takes warm moist air from the ocean surface and converts it into kinetic energy.
$$E = mL$$
In this simplified view, the energy ($E$) released is proportional to the mass of the water vapor ($m$) and the latent heat of vaporization ($L$). Sinlaku was feeding on an exceptionally deep pool of warm water in the Philippine Sea. This wasn't just surface warmth; the heat went down dozens of meters. Most storms churn the water, bringing up cooler layers from below which eventually acts as a brake. Sinlaku's path was a "hot spot" where the brake didn't exist.
The Data Latency Crisis
There is a dangerous lag between a satellite "seeing" an event and a forecaster "understanding" it. For Sinlaku, the telemetry had to be downlinked, processed into brightness temperatures, and then interpreted by algorithms that are still calibrated for "average" storms. Sinlaku was anything but average.
The industry likes to brag about "real-time" data, but in the world of life-and-death meteorology, five minutes is an eternity. An hour is a catastrophe. During the Sinlaku event, the delay in processing microwave scatterometry meant that the recorded wind speeds were consistently $20$ to $30$ km/h behind the actual physical reality on the water.
- Infrared Data: Updates every 10-15 minutes but only sees the "skin" of the storm.
- Microwave Data: Sees the internal engine but updates only twice a day per satellite.
- Dropsonde Data: The "gold standard" of measurements, but requires flying a plane directly into a Category 5 eyewall—a feat that is logistically impossible for every Pacific storm.
The Structural Collapse of Forecast Models
We have become overly reliant on the Dvorak Technique. Developed in the 1970s, this method estimates a storm's intensity based on its appearance in satellite imagery. It is a subjective art form masquerading as a science.
When Sinlaku’s eye cleared and its symmetry became near-perfect, the Dvorak numbers spiked. However, the internal dynamics—the eyewall replacement cycles—were behaving in ways the models didn't predict. The storm’s inner core collapsed and reorganized, a process that usually weakens a typhoon. Instead, Sinlaku emerged from the cycle larger and more resilient.
The disconnect between the "pretty" satellite picture and the chaotic fluid dynamics inside the storm is where people die. Emergency managers in the path of the storm were looking at models that suggested a plateau in intensity. The physics on the ground suggested an explosion.
The Ocean Heat Content Factor
Meteorologists often focus on Sea Surface Temperature (SST). This is a mistake. SST only measures the top millimeter of the ocean. The more critical metric is Ocean Heat Content (OHC), which measures the total energy available in the water column.
Sinlaku crossed an eddy of warm water that acted like a pocket of high-octane fuel. Because our satellite altimeters (which measure the height of the sea surface to infer OHC) only pass over specific areas every few days, this "fuel tank" was larger and deeper than anticipated.
The storm didn't just pass over warm water; it stayed over it. Its slow forward motion allowed it to drink from this reservoir for an extended period. Most models assume a certain forward speed; when a storm slows down over deep heat, the intensity goes off the charts.
Infrastructure is the Final Link
A storm is only as "super" as the vulnerability of the coast it hits. While the technological failure was in the prediction, the human failure was in the assumption of safety. Taiwan and the Philippines have some of the most sophisticated radar networks in the world, but radar is a short-range tool. By the time Sinlaku was within radar range, the window for meaningful deep-shore evacuation had closed.
The "cone of uncertainty" is a visual tool that has become a crutch. It tells you where the center of the storm might go, but it says nothing about the size of the wind field. Sinlaku’s tropical storm-force winds extended hundreds of kilometers from the center. People outside the "cone" felt safe, even as the outer bands were already dismantling their power grids.
The Cost of the Invisible
We spend billions on hardware but pennies on the connective tissue between data points. The Sinlaku anomaly proves that we cannot continue to rely on a patchwork of aging polar orbiters and subjective visual analysis.
The next generation of weather surveillance isn't about better cameras. It's about a constant, unbroken microwave "movie" of the Earth's atmosphere. Until we can see the internal rain structures of a typhoon in real-time, every thirty minutes, we are just guessing.
The ocean is getting warmer, and the "deep heat" pockets are becoming more frequent. This means Sinlaku isn't a one-off historical curiosity. It is the new baseline. Every hour of data latency, every missed microwave pass, and every reliance on 50-year-old visual estimation techniques represents a calculated risk that we are increasingly losing.
Build the sensors. Close the gaps. The strobe light needs to stay on.